|
| Plant Maintenance Resource Center
Asset Management at the Millenium
| |
|
|
|

|
ASSET MANAGEMENT AT THE MILLENIUMAuthor : Cyp F.H. van Rijn 1. Introduction.Two different surveys on the motivation for outsourcing maintenance were recently held in The Netherlands; one (blue, NIPO, 1994) addressing maintenance staff; another (ref, Ernst and Young, 1998) asking for the opinion of executives. Whereas the first category mainly valued the additional flexibility in terms of hiring-in specialist's skills and temporary work force capacity, the representatives from the boardroom essentially challenged the existence of an in-house maintenance function by putting heavy weights on the non-core business aspects, the desired change-over from fixed to variable costs and the expectation of significant cost savings.
Why such a large difference in perception? The importance of process reliability / availability is indisputable:
Part of the answer may lie in the culture of the maintenance staff. Organisational effectiveness and proper education is necessary to achieve the "improvement mode" and the "thinking like an operations manager, not like an appliance repairman" (LePree, 1999). We observed earlier a striking difference in evolution and user acceptance between such comparable fields as control engineering and reliability engineering (Van Rijn and Scholten, 1996). Over the last decades, a whole body of control and optimisation theory has been developed that now forms part of the standard curriculum of young engineers. New, advanced computerised control and optimisation techniques were easily accepted by Operations and now are considered as being indispensable. A comparable theoretical background of asset management still is missing; most of the literature on maintenance optimisation models does not fit in an engineering mindset, being too specialist and lacking an overall, systems engineering viewpoint (Dekker and Van Rijn, 1996). Reliability engineering is hardly ever integrated in the mechanical engineering curriculum and maintenance managers still lack effective decision support techniques at large. 2. Asset management.A fundamental reason for struggling with cost and recognition problems often is that maintenance departments have no proper place in the organisational structure of a company. The Maintenance Function, given its influence on profits and integrity, should have its own business plan with mission, vision and objectives derived from that of the company. Management control techniques have to be in place to achieve clearly defined targets and milestones at strategic, tactical and operational level (Fig. 2).
To allow the company to take strategic decisions, to evaluate new opportunities and/or meet new demands, asset management should be capable of providing detailed information on the production capabilities of existing installations preferably as a function of time. Planning and structuring of asset management takes place at the tactical level. Technical input is needed in new designs or redesign of existing facilities. Given asset reliability and maintenance characteristics, the Maintenance Function should be capable to estimate the probability of meeting requested demand both in long-term average terms and as a function of time over, say, five year periods. Critical process elements should be identified early to effectively focus design and maintenance management activities. Where possible, maintenance strategies should be based on cost-benefit calculations. Together with technical information, these findings are laid down in a maintenance reference plan (MRP), the structure of which has to be reflected in the data model of the computerised maintenance management system (CMMS). MRP's are usually updated every 5 years, reflecting changes in business climate and improved know-how of the installation. Operational management covers the execution of the activities laid down in the MRP; the most costly part of asset management where resources and material are consumed and interference with production takes place. It thus requires close attention of the maintenance manager to guarantee effectiveness and quality of work. Since the first MRP is based on either generic or historic data from comparable equipment, the well-known quality improvement cycle: plan, schedule, execute, analyse, improve applies here. Technicians should be well aware of the underlying reasons for a chosen strategy, the assumptions involved, such that they can provide essential feedback based on their observations. These three layers are strongly interdependent. For instance, a good plan will not provide the estimated cost-benefit if the underlying assumption of high quality of execution is not met. On the other hand, improving the latter on tasks that are not rewarding from a business perspective yields a similar ineffectiveness. Given the differences in goal-setting and execution monitoring, it is essential to locate management problems at the right level in the hierarchy (Grievink et al, 1993). Decision support tools that are easy and "safe" to be used by staff at all levels, expectedly lacking concise reliability engineering background, are essential to demonstrate the underlying reasons of the MRP in order to achieve acceptance and integration of the plan in the company. 3. SPARC, a decision support tool for maintenance engineers.Within Shell Research Amsterdam these observations led to the development of a decision support tool called SPARC that, fitting in an engineering (rather than a specialist) mindset, allows maintenance staff to make fact-based decisions in the design and operational phase of complex production systems. Since Monte Carlo simulation packages proved difficult to be used by (and to convince) practical engineers, SPARC uses an analytical approach. Via a graphical user interface, an engineer can easily model a system and analyse its steady state or time-dependent behaviour. Calculations normally take less than 1-2 minutes on a standard personal computer, thus making SPARC an effective tool in solving "what if" questions. SPARC has been successfully used in a large number of Shell Exploration and Production companies with typical applications like redundancy / availability optimisation, equipment selection, risk analysis, maintenance strategy and maintenance manning level optimisation. It proves to be an effective vehicle in integrating skills in a project organisation, since various experts can work with the same model. After the business reorientation in Shell, Program 42 Consulting Ltd. obtained an exclusive license to market / lease this package both within and outside Shell and its affiliates.
SPARC uses two different ways of representing the process. The first is a top-down, tree-type decomposition of the process into systems; any failed system (power, compression, ..) will bring the process in a downstate. Systems are composed of equipment units (vessels, pumps, instrumentation, ..) linked in reliability engineering terms in a serial or parallel configuration. Units are characterised by their processing capacity, e.g. in MMbbls/day, m3/h, .. and by their starting date. Each unit will have one, or a number of specified tasks that have to be maintained; in SPARC terms: maintainable conditions (MC's). MC's may fail in one or various failure modes (fm). The probability of failure as a function of time is expressed via the Weibull a and b parameters, where a represents a characteristic time constant (for b = 1: the mean time between failures) and b the time-dependency (b = 1: constant failure rate, random failures; failure rate is proportional to timeb-1). The consequence of failure is modelled by the expected downtime and the (operational) capabilities to reduce the effect; the (local) capacity after failure is taken to be reduced from its initial value to a bypass capacity, that may range from 0 - 100 %. Maintenance strategies are based both on these fm-descriptions and on the technical effectiveness of planned maintenance. Finally, maintenance activities may be grouped into packages (MP's). SPARC offers the following maintenance strategies:
The model assumes the failed element to be "as-good-as-new" after each intervention. To model partial replacements where this assumption is invalid, a fourth category "block with minimal repair" where repair leads to "as good as old" is available. Each activity is characterised by downtime, man-hours involved (up to five categories) and (set-up, material) costs.
On basis of this model and the input data, SPARC derives the time-profile and steady state (long-term average) value of the up- and downtime distributions of the various model elements. Using an availability block representation (Fig. 4), a large number of output variables may be calculated, both as long term averages or as time dependent values in periods and a time horizon defined by the user:
The output is generated in the form of Excel tables and graphs, allowing easy connection with standard word processors. 4. Example 1: design evaluation of a production platform.
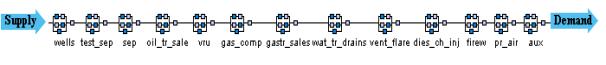
Fig. 5 shows the availability block diagram of a production platform ( a screen-dump from the SPARC graphical user interface). Seven wells, each of 50 Mbbl/day feed via risers and templates into a platform with a design capacity of 300 Mbbls/day oil equivalent, where oil and gas are separated, metered and transported via two pipelines. The platform also houses a vapour recovery system, glycol and chemical injection facilities and a number of auxiliaries. The purpose of this study is to assess the expected annual production and (unplanned) manhours at an early stage in the design. Since equipment selection is supposed to be not yet final, only generic reliability, downtime and resource consumption data like in Oreda (Oreda, 1997) or historical in-house data at unit level can be used. Such figures are best regarded as long term averages of "standard" operation, using various maintenance strategies. Therefore we use a constant failure rate concept (Weibull b = 1) and a characteristic time a equal to the observed MTBF. About 280 failure modes are taken into account in this model using the Oreda classifications of critical, degraded and incipient. A first analysis shows that the system is capable to deliver on average 269.4 Mbbls/day, which is 89.8% of the platform capacity. Based on Oreda data we expect an annual workload for unplanned maintenance of 14 772 man-hours divided over the various system units as given in Fig. 6 (to cover the range, the man-hours are plotted on a logarithmic scale)
With SPARC the designer easily can carry out a sensitivity / criticality analysis to estimate the change in system capacity if a given sub-system would be 100% available.
Fig. 7 shows the gas-compression train to cause most of the production losses; if only this system would be 100% available (with the other units unchanged), the annual production would increase by 5393 Mbbls. Second in importance is the gas-transfer & sales section; if 100 % available the output would be 1924 Mbbls/y more than the original system.
Given the design structure, the many FM's and bypass capacities, the system can operate at various capacity-levels. The average production of 269.4 Mbbls/day can further be analysed in a production envelope as given in Fig. 8. This figure shows the cumulative probability of a given production level over a time-interval selected by the user, a parameter of importance in dealing with sales agreements. For example, the original system has a 96% probability of meeting a demand volume per month between 0 and appr. 70%; for a level between 70 and 82% this probability drops to 78%, to reach a level of 75% at the maximum system capacity. We noted already that the compression train turned out to be the most critical system. The designer now may quickly evaluate design alternatives by cutting, copying and pasting in the GUI. Fig 8 shows that adding a fourth train of 105% capacity to the existing three has almost the same effect as increasing the capacity of each train to 150%. The cost benefit of such design alternatives are easily calculated, given the capital investment costs and the SPARC assessment of production and resources. 5. Example 2: time-dependent behaviour of a compressor system.This type of long-term assessments are a viable step in the first analysis of a preliminary design, where decisions on design alternatives almost without exception will determine the system configuration during its economic life. However, it does not show the ability of the Maintenance Function to manage unavailability; a well chosen maintenance strategy can effectively support Operations to "produce the right amount of products at the right moment in time".
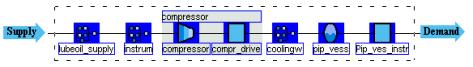
Fig. 9 shows the screen-dump of the availability block-diagram of a (reciprocal) compressor system containing the compressor, the lubrication oil and cooling water system, the associated vessels, piping and instrumentation. Reliability and maintenance data for the SPARC model were taken from generic sources, enhanced by expert opinion and the first four years of field data in the CMMS.
Fig. 10a
Fig. 10a shows the evolution of expected monthly availability over time since the starting date of the system. Effective management requires such time-dependent information, rather than a long-term average (Fig 10b) like A = MTBF / (MTBF + MTTR)! The compressor is seen to have the largest contribution to system unavailability, followed by the lubricating oil system. Clearly visible are the effects of planned maintenance routines; temporarily reducing the system availability due to the associated downtime, restoring however part of the reliability of operation thereafter.
The installed preventive maintenance programme has an appreciable effect on the expected output of the platform. Fig. 11 compares the monthly expected unavailability (loss in production) of the installed system with the same using breakdown maintenance only. Clearly, the maintenance manager is capable of reducing the unavailability by some 40%, about seven days of production per year. This benefit occurs in spite of the involved system shutdowns (the green peaks in Fig. 11); a proper timing of these activities with respect to demand can significantly further improve the effectiveness. Fig. 12 shows the additional man-hours (light green : planned (preventive) maintenance, dark green: remaining corrective maintenance; red: corrective man-hours using no planned maintenance), similarly required for a proper cost-benefit analysis.
6. Conclusions.Asset management is an important managerial topic in the oil production sector, both from an economic point of view, as well as in relation with safety and environment. The current low profile of the maintenance function with its strong focus on technical aspects, observed in a number of companies, has to be changed to a facts-based, pro-active management attitude. In fact, the maintenance function has to develop itself into a business unit with mission, vision and objectives derived from that of the company. A proper recognition of the various layers in the asset management hierarchy then is essential to structure decisions. To be on a par with, and to convince other decision-makers, effective decision support tools, like SPARC, that are easy to use by engineers and technicians at various levels in the organisation are essential to compare alternatives and strategies, deepen insight, achieve co-operation and feedback of all staff involved. References:Anon (1994), Industry analysts focus on US, Asian, Latin American markets, Oil and Gas Journal Special, April 25, p 45 Cooper, B. (1992), Maintenance Strategy procedures, development and implementation, Third ESReDA Seminar on Equipment Ageing and Maintenance, Chamonix, October 14 - 15 Dekker, R and C.F.H. van Rijn, (1996), Operational Research supports maintenance decision making, in L.Fortuin, P.van Beek and L.van Wassenhove "OR at wORk", Taylor and Francis, London, ISBN 0 7484 0456, pp 93 - 109 Drogaris, G. (1993), Major Accident Reporting System. Lessons Learned from Accidents Notified, Elsevier Amsterdam Grievink, J., K.Smit, R.Dekker and C.F.H. van Rijn (1993), Managing Reliability and Maintenance in the Process Industry, Foundations of Computer Aided Process Operations FO-CAPO, Crested Butte, Colorado, July 18 - 23, CACHE Lepree, Joy (1999), Maintenance at the millennium, IMPOmag.com, Feature Focus, October 1999. OREDA-97, Offshore Reliability Data Handbook 3rd Edition, 1997, Det Norske Veritas, Hovik, Norway Pierce F.R. (1987), "Invited comments on maintenance planning", in G.V. Reklaitis and H.D.Spriggs (Eds) Proceedings of the Foundations of Computer Aided Process Operations (FOCAPO), Park City, Utah, USA, CACHE, pp 272 - 280 Van Rijn, C.F.H. and P. Scholten (1996), "Integral management of production assets", Maintenance, June About the author.
Copyright 1996-2009, The Plant Maintenance Resource Center . All Rights Reserved.
|